SEARCH
Categories
Tags
Links
Archives
- September 2015
- July 2013
- May 2013
- September 2011
- January 2011
- December 2010
- November 2010
- September 2010
- August 2010
- July 2010
- May 2010
- April 2010
- March 2010
- December 2009
- November 2009
- October 2009
- September 2009
- August 2009
- June 2009
- May 2009
- April 2009
- March 2009
- February 2009
- January 2009
- December 2008
- November 2008
Visualizing Library Checkout Data in 2D Space
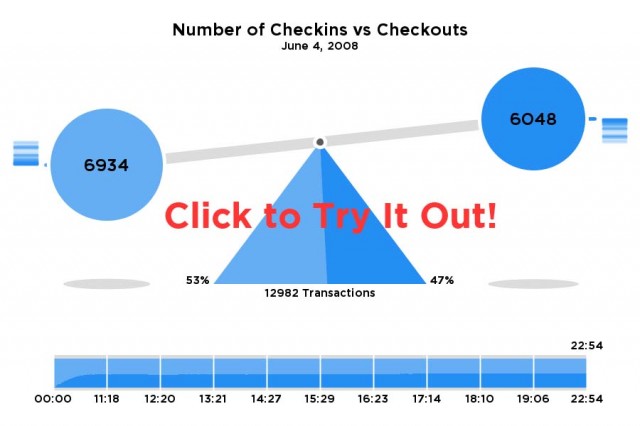
The second project for MAT259: Data Visualization involved exploring two dimensional space for visualizing data from the Seattle Public Library. I was interested in getting away from the traditional chart mentality and displaying data in a more unique way.
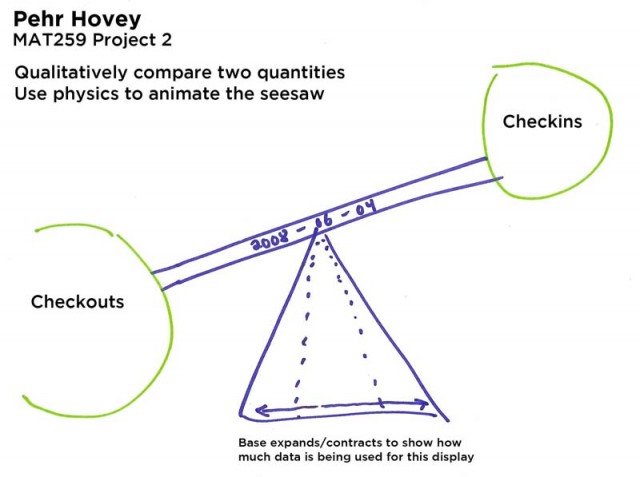
I settled on comparing two numerical quantities using a seesaw or balance/scale metaphor. I chose to enumerate the number of checkins and checkouts over time to analyze how they relate and how the balance changes over time.
I found that most days the trend is about flat except for in the first part of the day when the library is not open but people are able to perform certain functions through the library website.
Below is the rough concept sketch:

